Building a Production-Grade Observability Stack from Scratch — Prometheus, Grafana, Loki & Alertmanager
A hands-on walkthrough of building a centralized monitoring and logging platform using Prometheus, Grafana, Loki, Alertmanager, and Grafana Alloy — with Docker Compose, .env-driven config, AWS S3 log storage, EC2 service discovery, and email alerting.
Why I Built This
Modern infrastructure is only as reliable as your ability to observe it. After weeks of running workloads across distributed servers without real insight into what they were doing, I decided to invest a full week building a production-grade observability stack from scratch.
The goal was clear: a single, centralized monitoring platform that could tell me — in real time — exactly what is happening on every server, inside every Docker container, and across every key application. If something breaks, I want an email the moment it happens. When it recovers, I want to know that too.
One week later, I have exactly that — and this post walks through the entire system, top to bottom.
Tech Stack at a Glance
| Component | Role |
|---|---|
| Prometheus | Metrics collection and alerting engine |
| Grafana | Visualization and dashboards |
| Loki | Log aggregation (with S3 backend support) |
| Alertmanager | Alert routing, grouping, and email notifications |
| Grafana Alloy | Lightweight agent for log and metric forwarding |
| Node Exporter | Host-level OS metrics |
| Process Exporter | Per-process CPU, memory, file descriptor metrics |
| cAdvisor | Per-container resource metrics |
| Nginx / Jenkins / MongoDB Exporters | Application-layer metrics (optional, profile-based) |
The Architecture
The system follows a Client–Server model. A central Monitor Server runs the core observability components (Prometheus, Grafana, Loki, Alertmanager). Any number of Client Nodes — whether on AWS EC2, on-premise, or anywhere else — run lightweight exporters and agents that push metrics and logs to the Monitor.
1
2
3
4
5
6
7
8
[Client Node]
  Node Exporter       → Prometheus (CPU, RAM, disk, network)
  Process Exporter    → Prometheus (per-process metrics)
  cAdvisor            → Prometheus (container metrics)
  Grafana Alloy       → Loki (logs) + Prometheus (metrics)
  Jenkins Exporter    → Prometheus (jenkins metrics)
  Nginx Exporter      → Prometheus (nginx metrics)
  MongoDB Exporter    → Prometheus (mongodb metrics)
1
2
3
4
5
[Monitor Server]
  Prometheus          → Grafana (visualize)
  Loki                → Grafana (logs)
  Alertmanager        → Email (alerts)
  Grafana             → Dashboards
Everything lives inside Docker Compose for clean, reproducible deployments. A single .env file per node controls the entire configuration — endpoints, credentials, environments, ports, storage backends — everything. No hardcoded values, no manual edits across files.
What Gets Monitored
System & OS Metrics (Node Exporter)
Every client node exposes CPU usage, RAM utilization, disk I/O, filesystem usage, and network throughput in real time. These are the foundational metrics that power alerts like HighCPUUsage, HighMemoryUsage, and HighDiskUsage.
Useful PromQL examples for node-level monitoring:
# CPU usage percentage (per node)
100 - (avg by(instance)(irate(node_cpu_seconds_total{mode="idle"}[5m])) * 100)

# Memory usage percentage
(1 - node_memory_MemAvailable_bytes / node_memory_MemTotal_bytes) * 100

# Disk usage percentage
(1 - node_filesystem_avail_bytes / node_filesystem_size_bytes) * 100
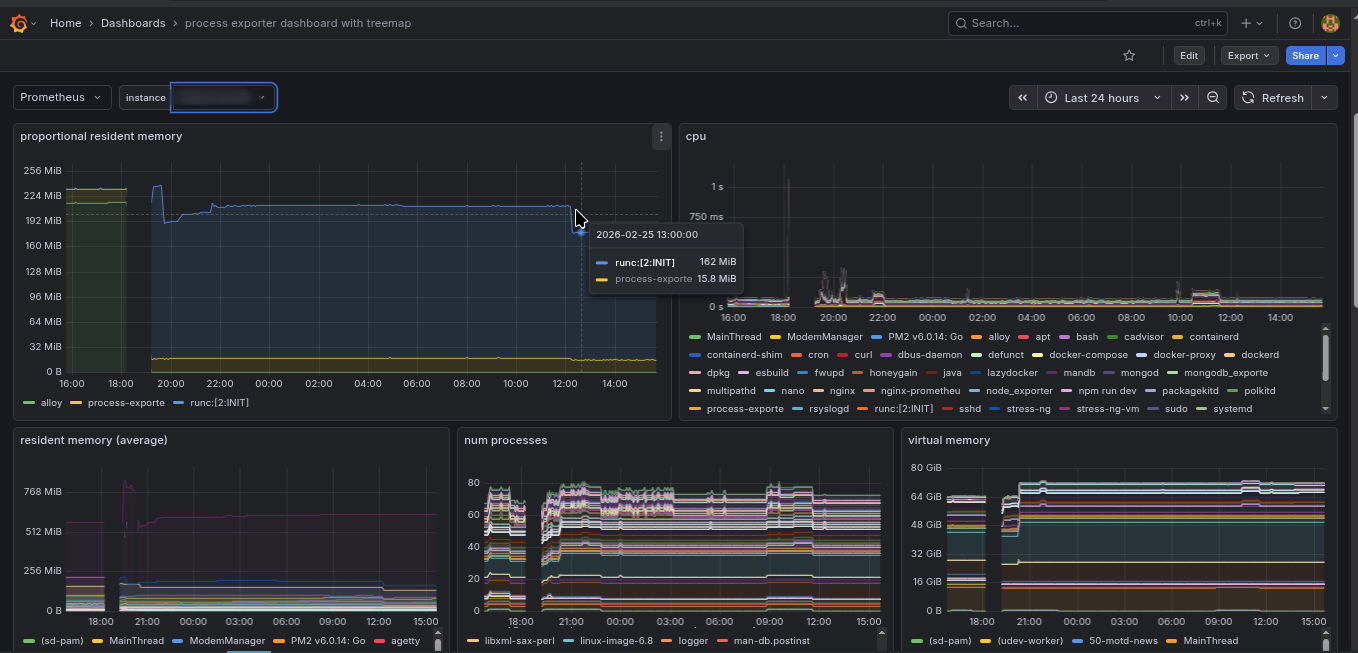
Per-Process Metrics (Process Exporter)
Beyond top-level CPU and RAM, the Process Exporter tracks individual processes — how much CPU a specific daemon is consuming, its open file descriptors, its memory footprint — giving a surgical view into what exactly is causing load on a host.
This is especially useful for debugging cases where overall CPU is high but top alone doesn’t tell the full story.
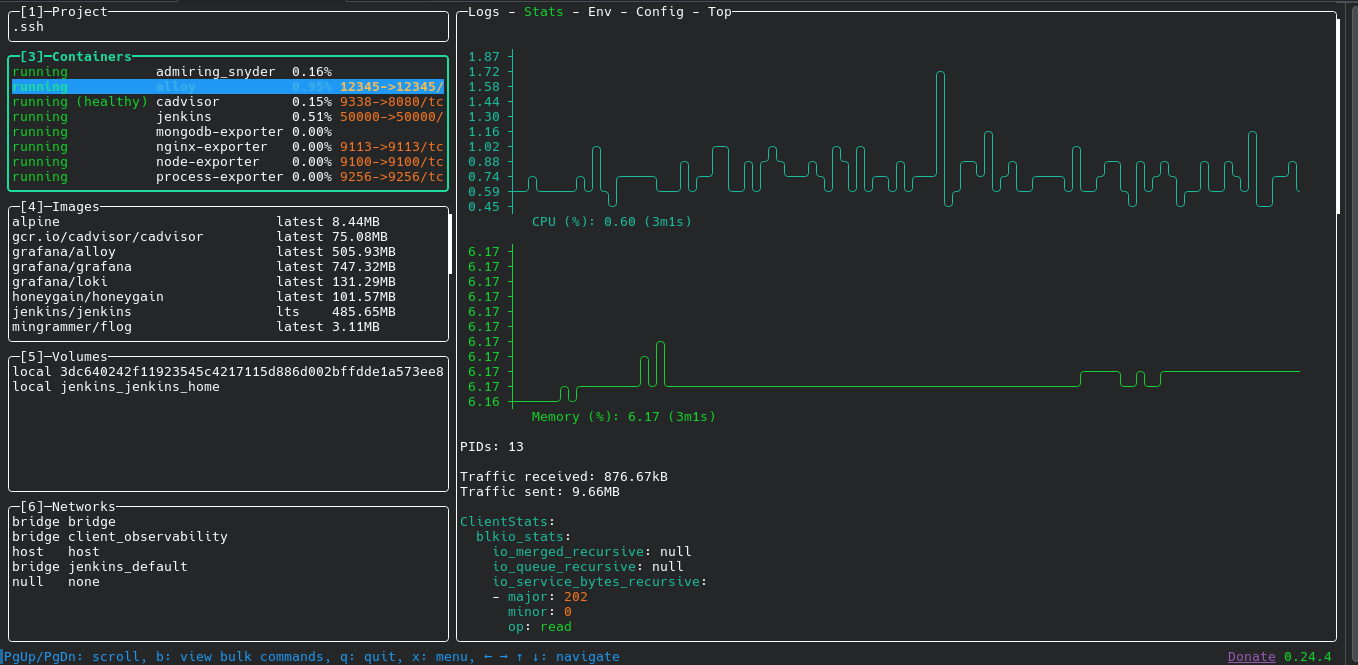
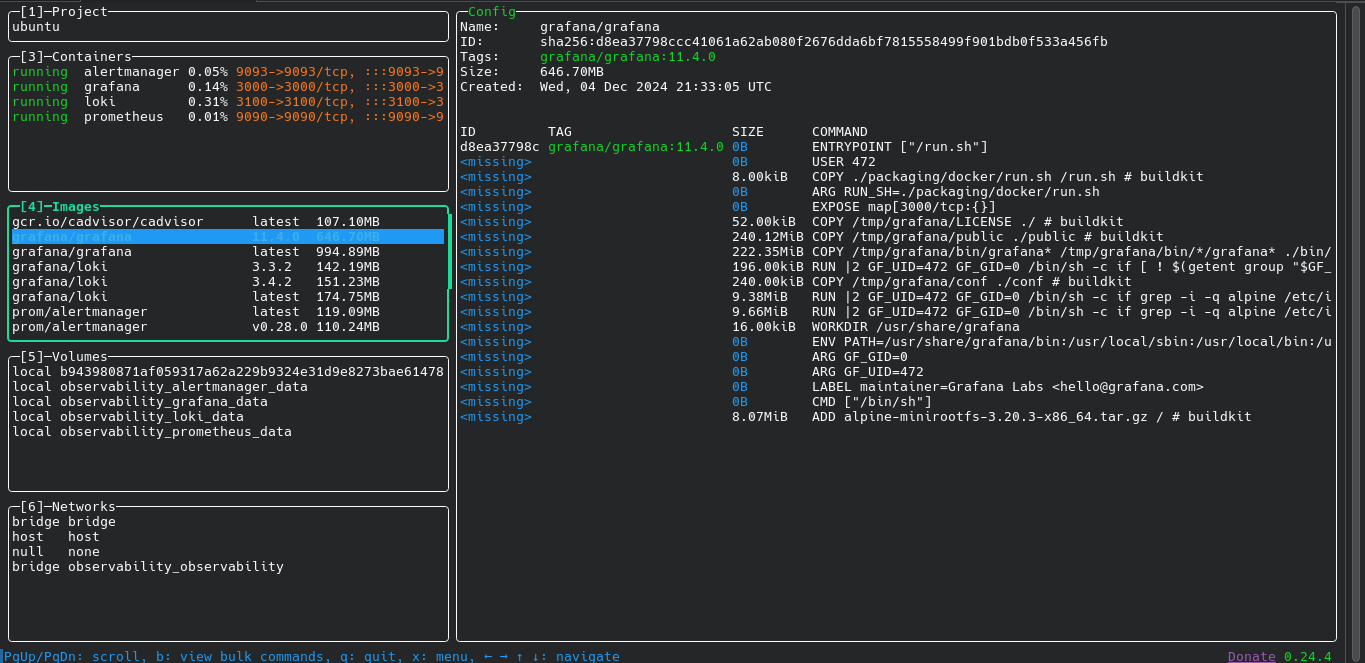
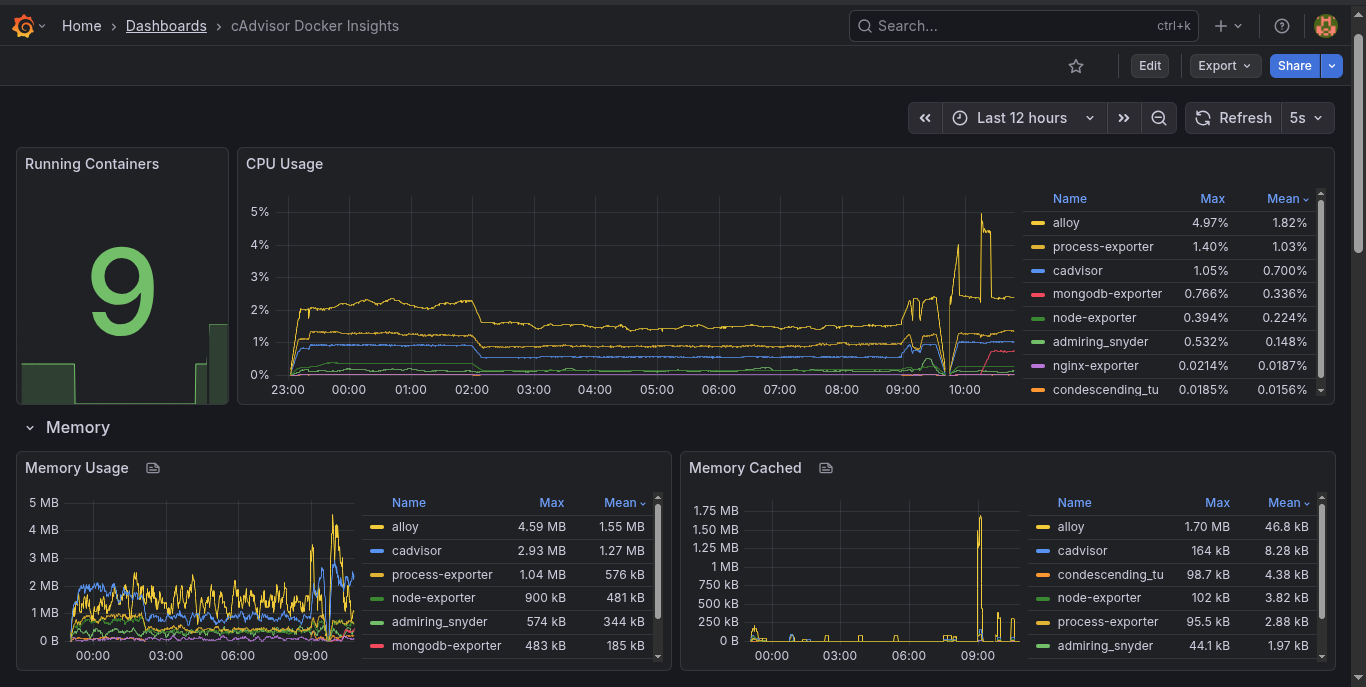
Container Metrics (cAdvisor)
Rather than just seeing that “Docker is using too much memory”, cAdvisor breaks down resource usage per container: CPU throttling, network I/O per container, and memory limits vs. actual usage. Jenkins eating your RAM? cAdvisor catches it before you even notice.
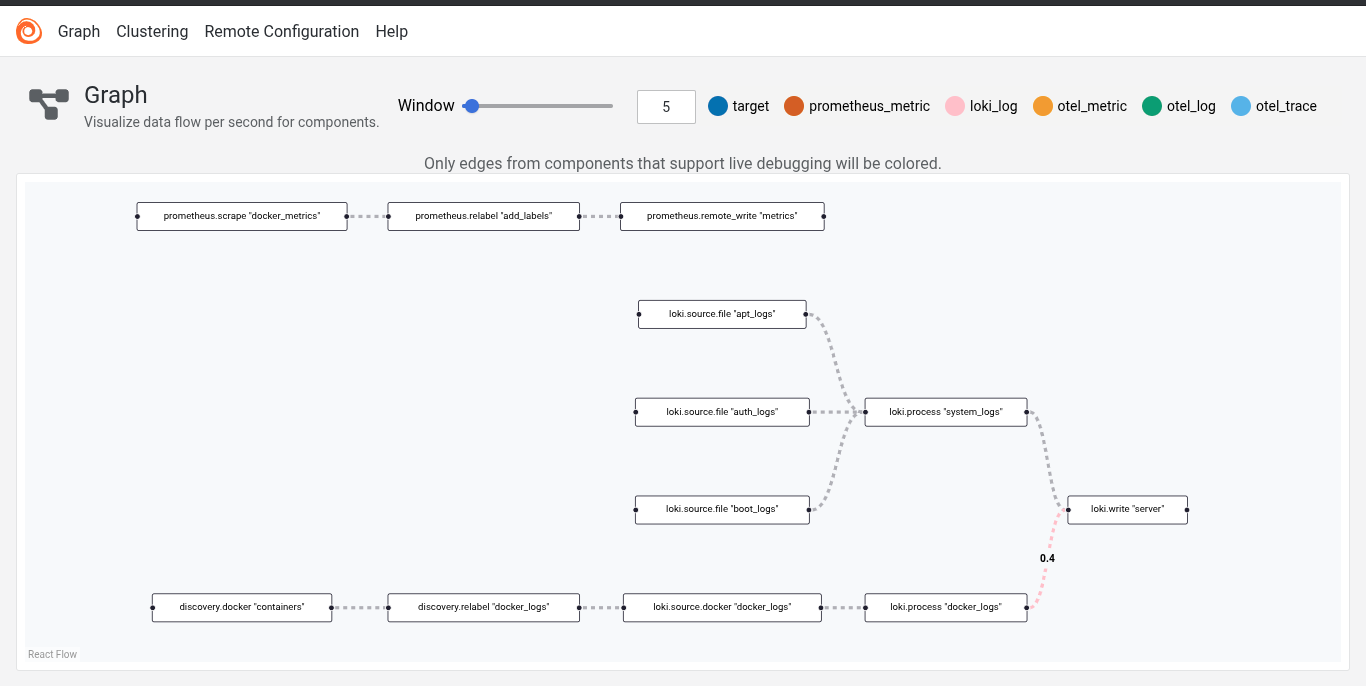
Container Logs and Metrics (Grafana Alloy)
Grafana Alloy is the Swiss Army knife of the client stack. It handles three critical jobs:
- System logs — reads
/var/log/*and pushes them to Loki. - Docker container logs — reads logs via the Docker socket and pushes them to Loki, labeled by container name, hostname, and environment.
- Docker daemon metrics — scrapes
127.0.0.1:9323and remote-writes them to Prometheus.
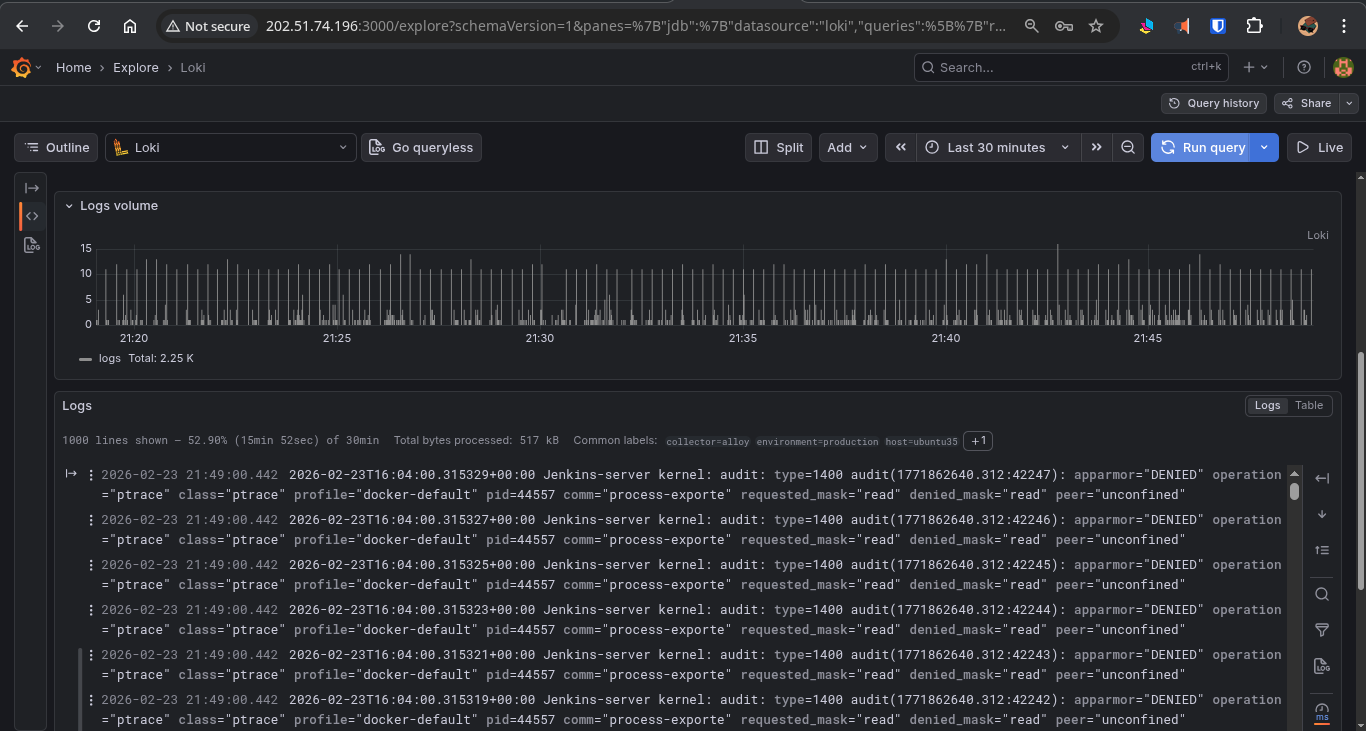
Every log line from every container on every node lands in a central Loki instance, queryable via LogQL in Grafana. Example log query:
{hostname="web-01", container="nginx"} |= "error" | logfmt
Grafana Alloy Pipeline Graph
Application-Layer Metrics
The stack ships with optional exporters for the most common workloads, enabled via Docker Compose profiles — so they don’t consume resources unless you need them:
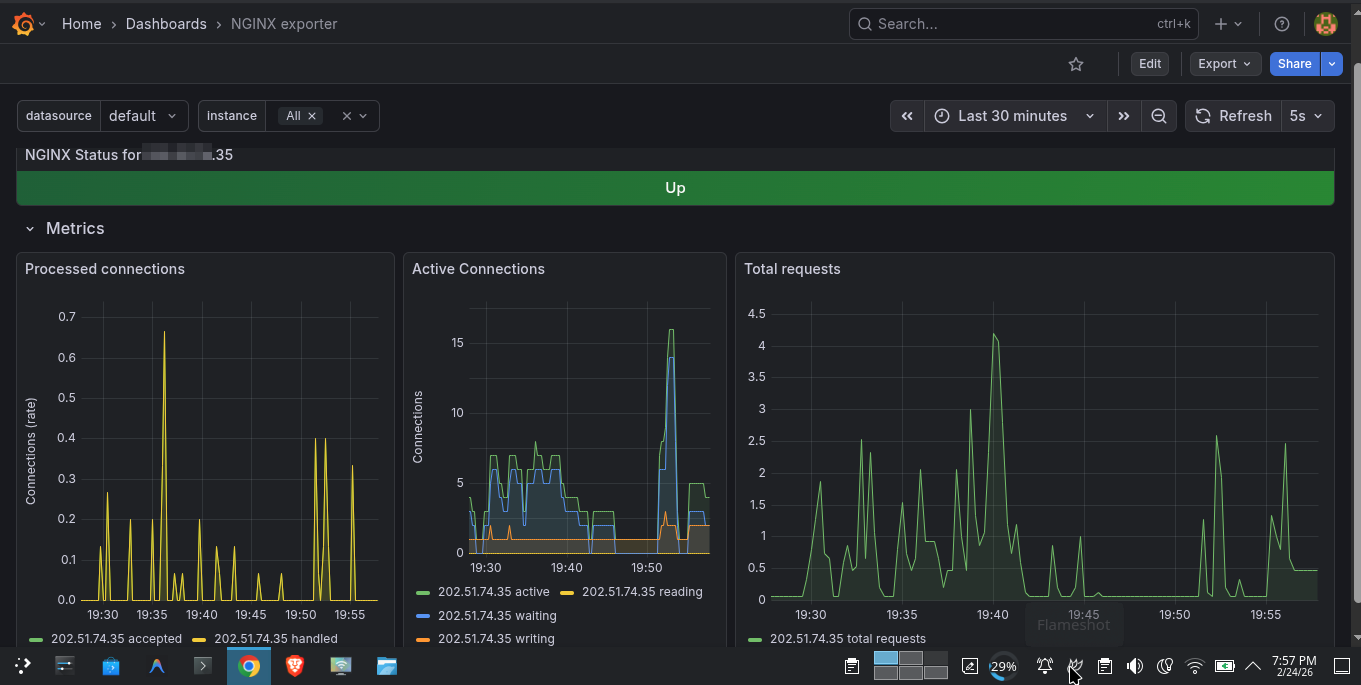
- Nginx Exporter — Request rates, connection counts, active worker count. Uses Nginx’s built-in
stub_statusendpoint.
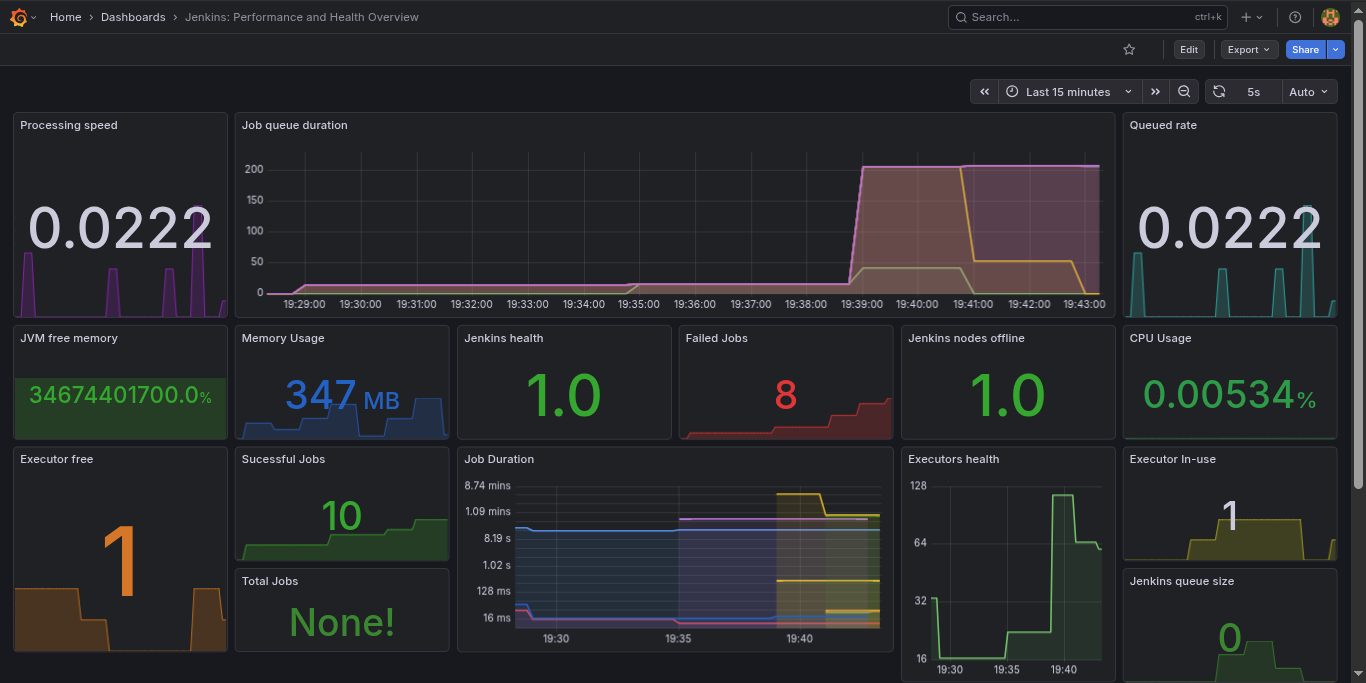
- Jenkins Exporter — Build queue depth, job health, executor utilization.
- MongoDB Exporter — Connection pool, query performance, operation counters (via
percona/mongodb_exporter).
- PostgreSQL, MySQL, Redis — All pre-wired and disabled by default. Enable any of them with a single Docker Compose profile flag.
Log Management with Loki
All logs — system logs, application logs, Docker container logs — are aggregated by Grafana Alloy and pushed into Loki. Unlike Elasticsearch, Loki indexes logs by labels (hostname, environment, container name, log level) rather than the full text, making it incredibly storage-efficient and operationally simpler.
Switching Storage Backends with One Line
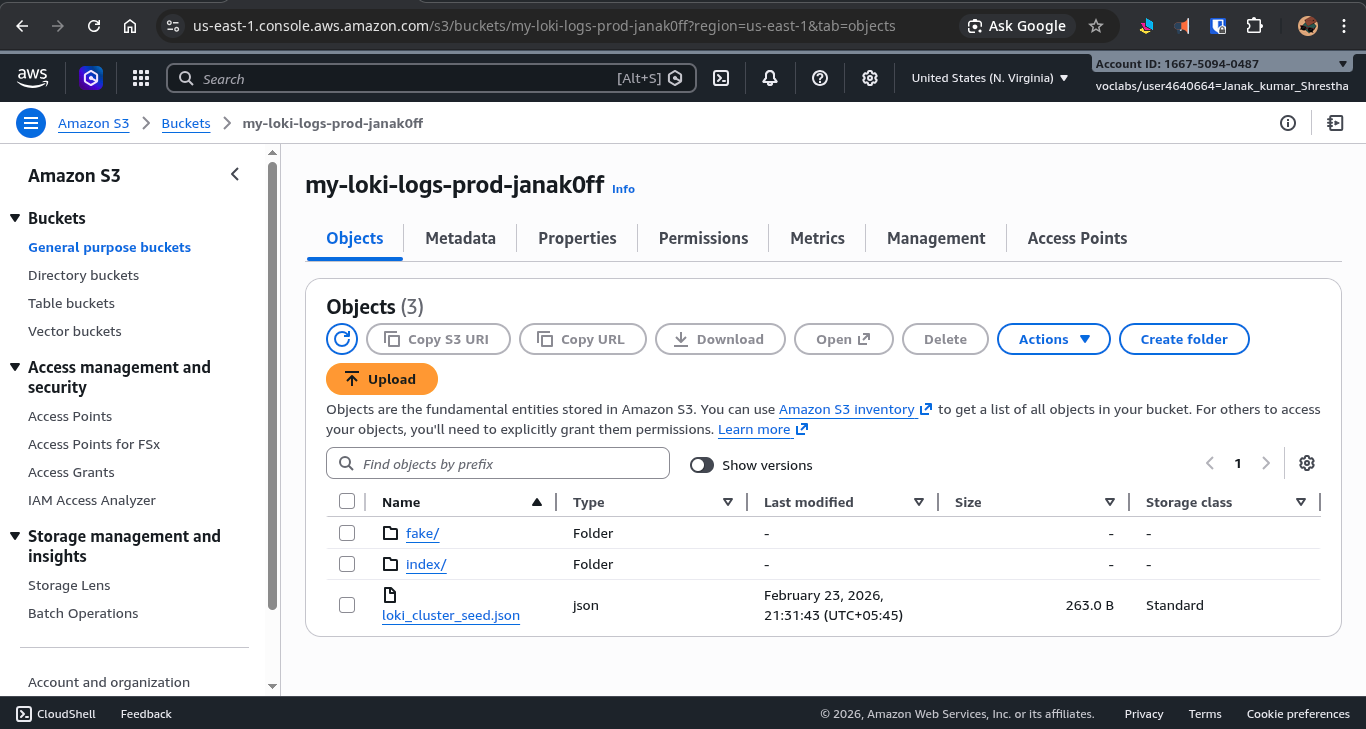
By default, Loki stores logs locally on the filesystem. Switching to AWS S3 for persistent, scalable cloud storage requires only updating a few variables in the .env file:
LOKI_STORAGE_TYPE=s3       # was: filesystem
LOKI_BUCKET_NAME=my-bucket
AWS_REGION=us-east-1
Restart Loki, and all new logs go directly to S3. The bucket also has a 30-day lifecycle policy attached, automatically expiring old log chunks without manual cleanup.

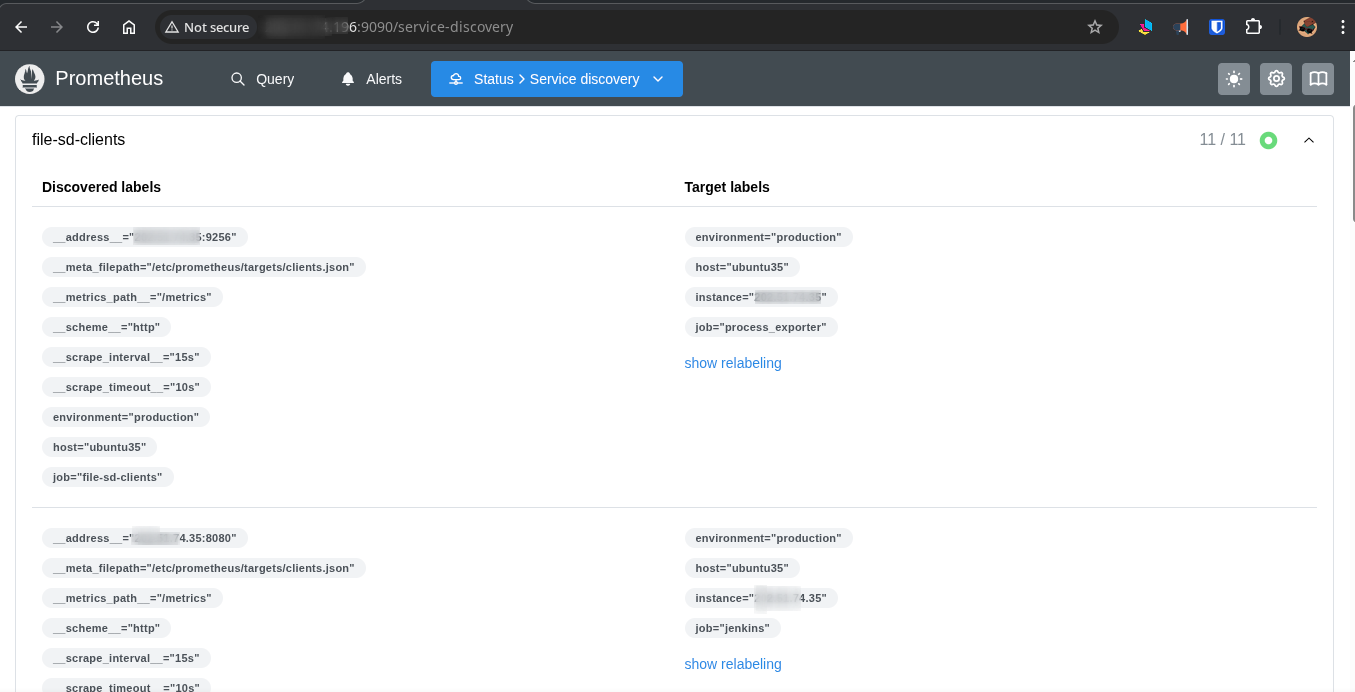
Service Discovery — Two Modes
Prometheus needs to know where to scrape. This stack supports two discovery mechanisms — one manual, one fully automated.
File SD (Manual / On-Premise)
For nodes not on AWS, the stack uses Prometheus File Service Discovery. The Monitor server maintains a single JSON file, prometheus/targets/clients.json. Two shell scripts manage it:
Adding and removing nodes
1
2
3
4
5
# Register a new node (with optional application exporter flags)
./scripts/add-node.sh 34.230.91.8 web-frontend production --nginx

# Decommission a node cleanly
./scripts/remove-node.sh web-frontend
Prometheus detects the JSON file change within 30 seconds. No restarts, no downtime.
File Service Discovery
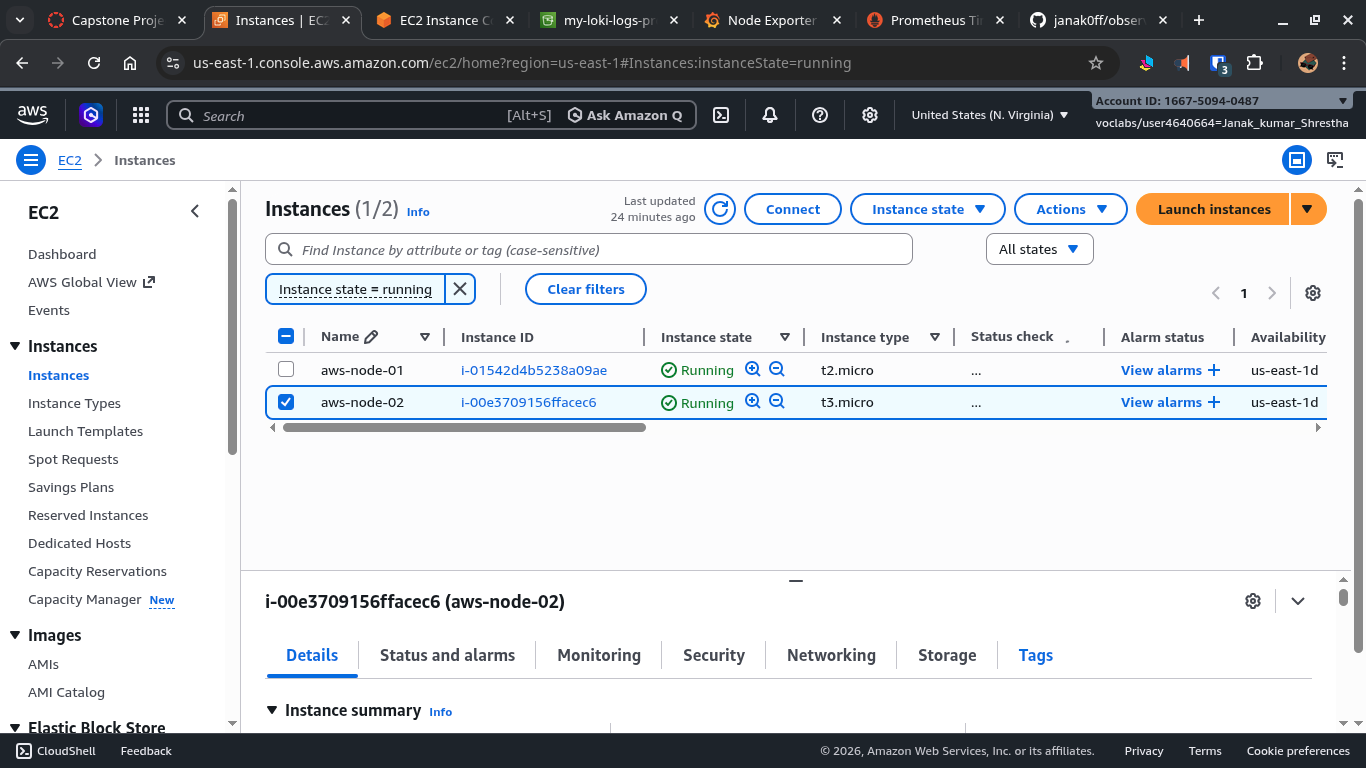
EC2 Service Discovery (Automated)
For AWS-native deployments, Prometheus can auto-discover EC2 instances based on resource tags:
- Tag an instance with
Scrape=trueandName=aws-node-01. - Prometheus queries the EC2 API every 60 seconds and automatically begins scraping it.
- Remove the tag, and scraping stops — automatically.
No static IPs. No manual config file edits. Infrastructure scales, and monitoring follows.
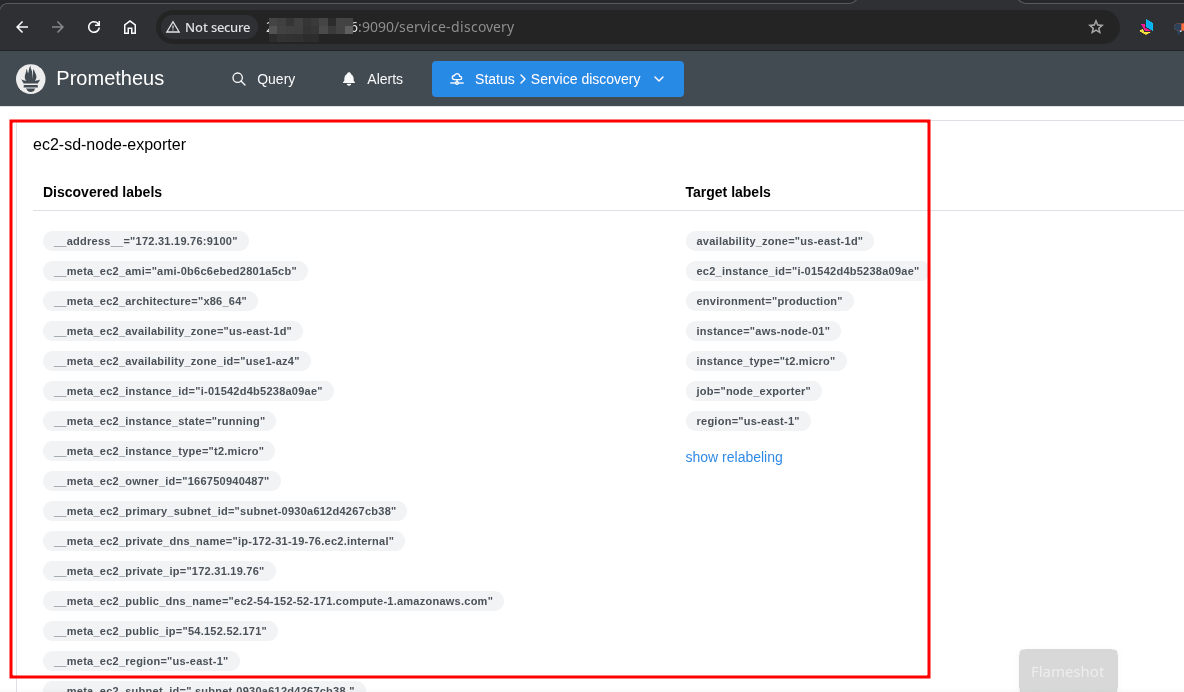
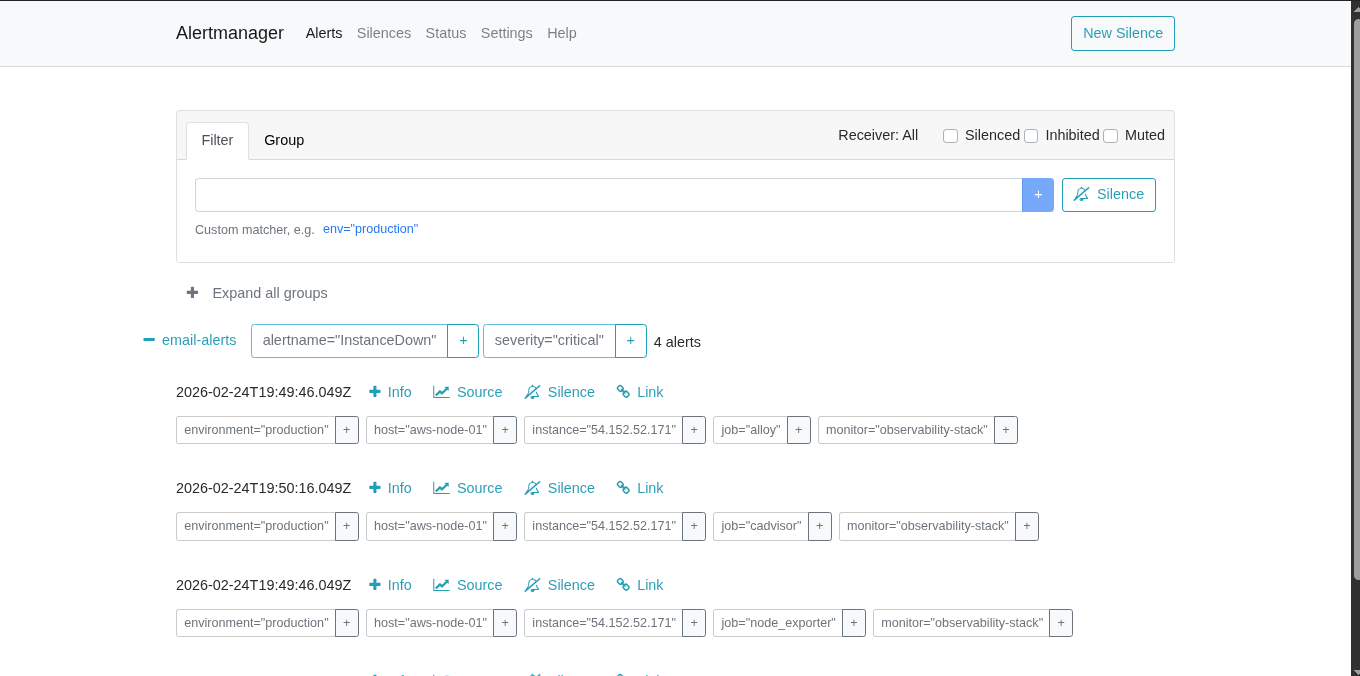
AWS EC2 Console
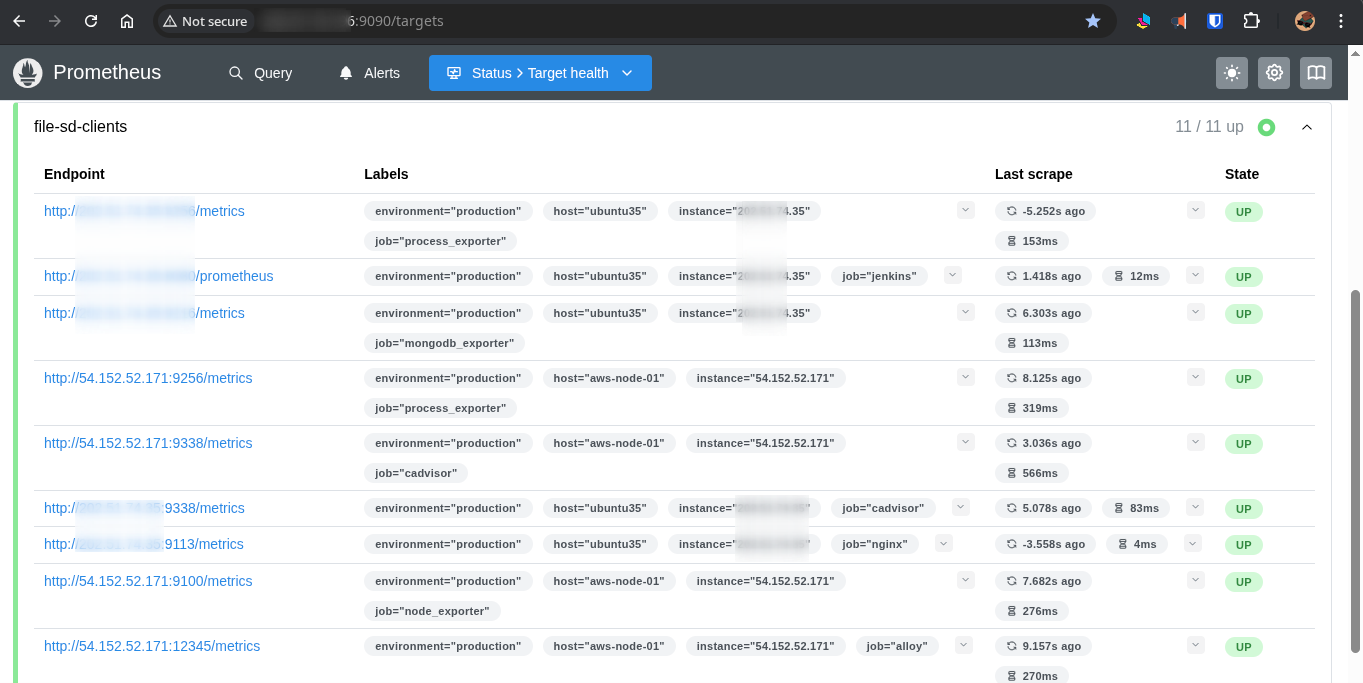
All Prometheus Targets
Alerting
How Alertmanager Works
This is where the project really comes together. Alertmanager handles all alert routing — it receives firing alerts from Prometheus, groups them, deduplicates them, and routes them via SMTP email.
It distinguishes between two lifecycle states for every alert:
- FIRING — something is wrong right now.
- RESOLVED — the condition has returned to normal.
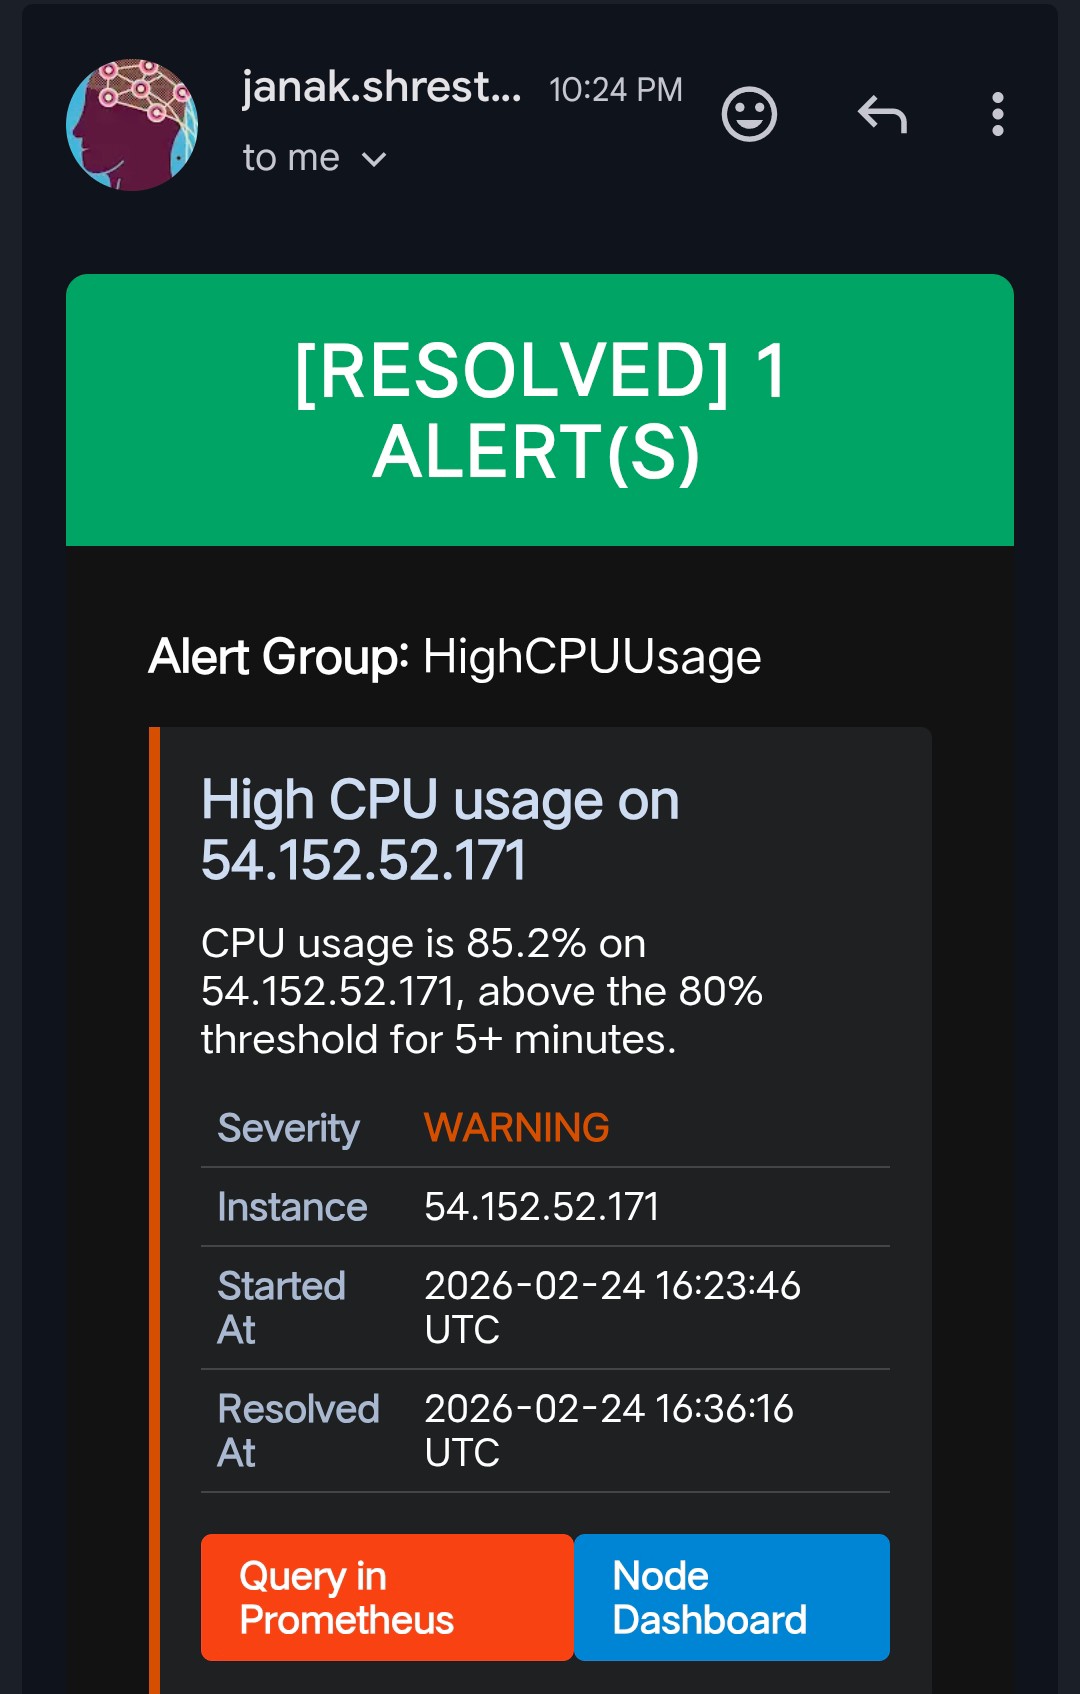
When an alert fires, Alertmanager sends an email. When it resolves, a second email is sent automatically — so there’s no guessing whether the issue is still ongoing. You get a clear timeline: when it broke, and exactly when it recovered.
This behavior required no extra code. Alertmanager’s send_resolved: true configuration handles it natively.
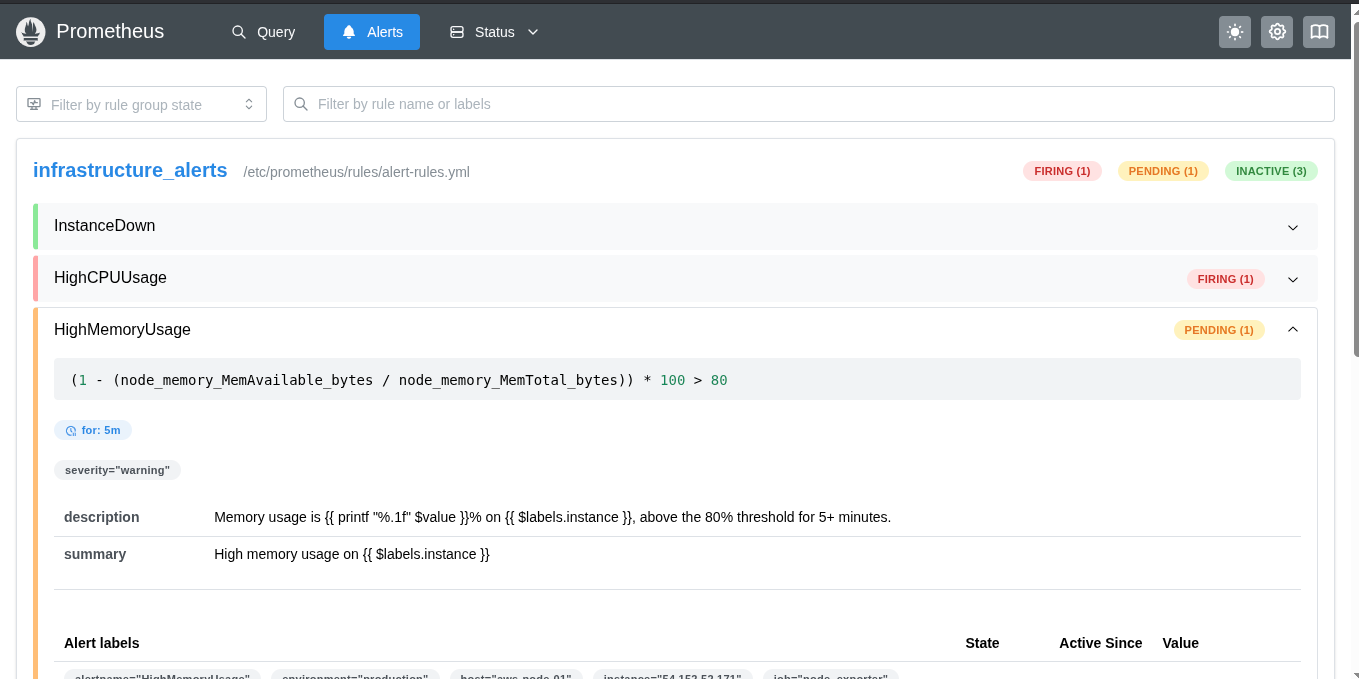
Alert Rules
Here are the alert rules currently active in the stack:
| Alert | Condition |
|---|---|
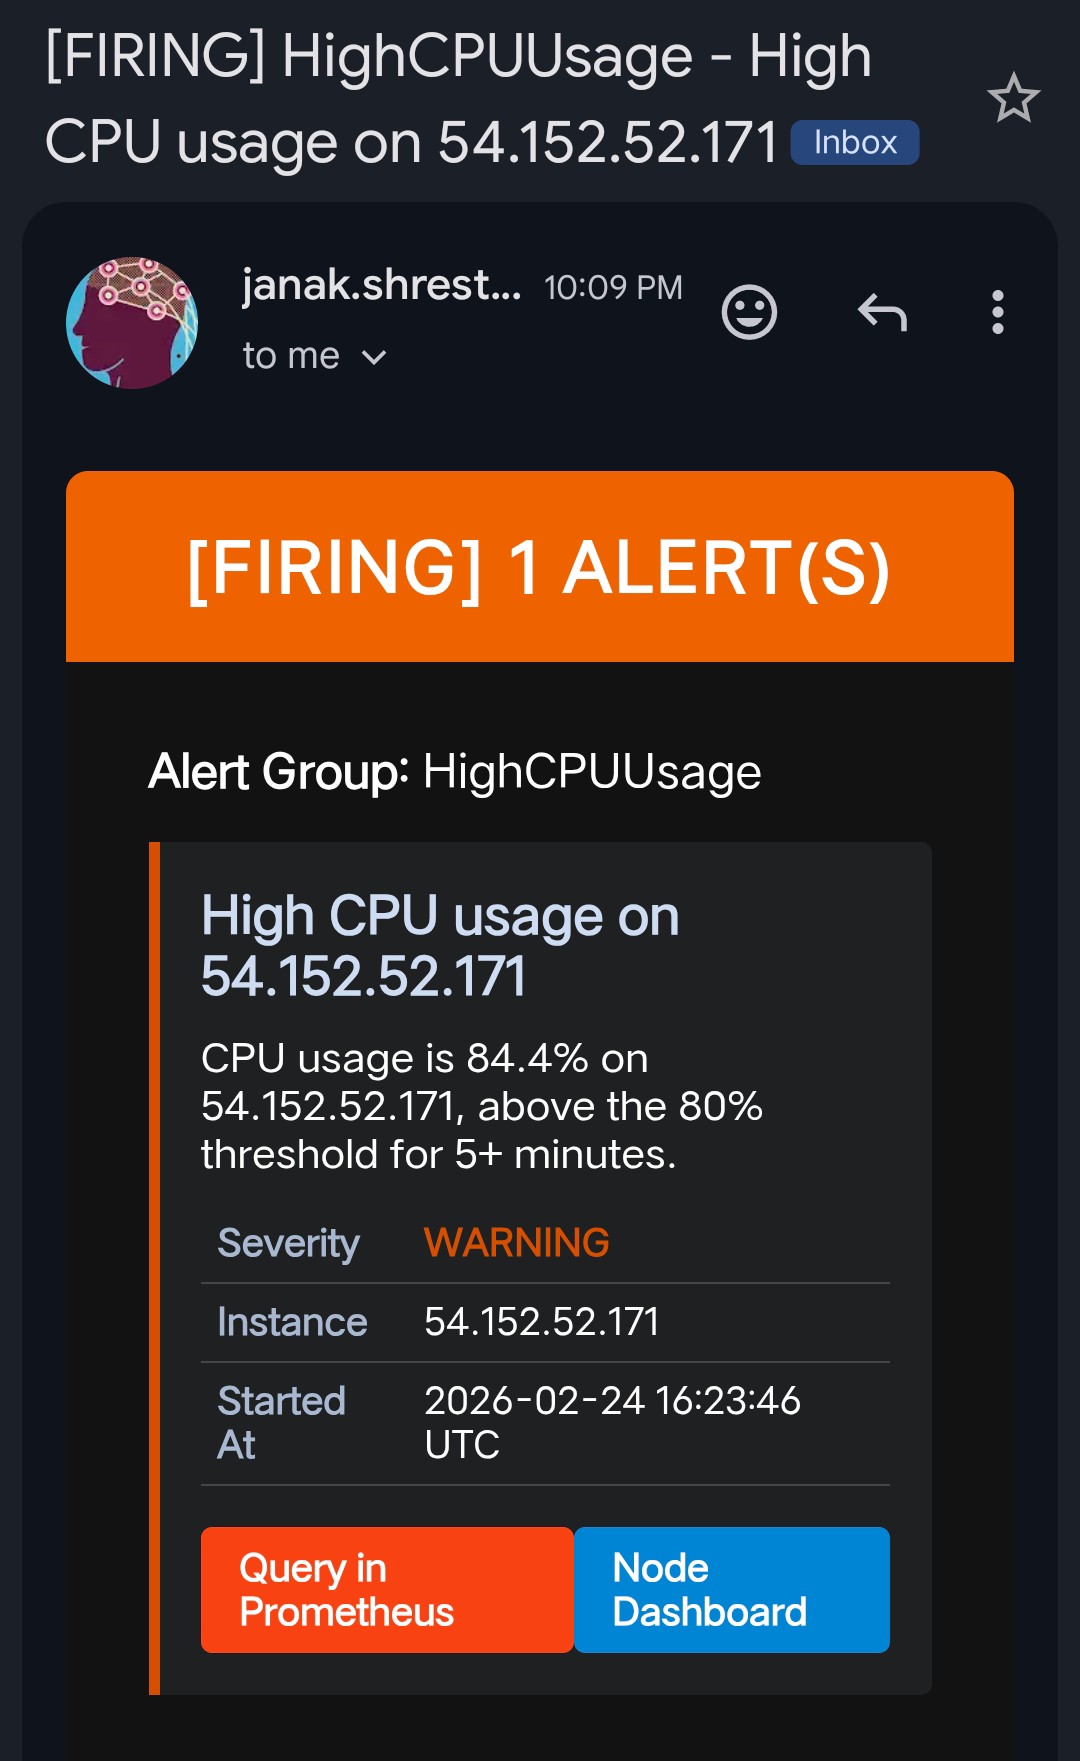
HighCPUUsage | CPU above 80% sustained for 5 minutes |
HighMemoryUsage | RAM above 85% sustained for 5 minutes |
HighDiskUsage | Filesystem above 85% used |
NodeDown | A target becomes unreachable for 2 minutes |
ContainerDown | A Docker container exits unexpectedly |
Example alert rule (from alert.rules.yml):
1
2
3
4
5
6
7
8
- alert: HighCPUUsage
  expr: 100 - (avg by(instance)(irate(node_cpu_seconds_total{mode="idle"}[5m])) * 100) > 80
  for: 5m
  labels:
    severity: warning
  annotations:
    summary: "High CPU usage on "
    description: "CPU usage has been above 80% for more than 5 minutes."
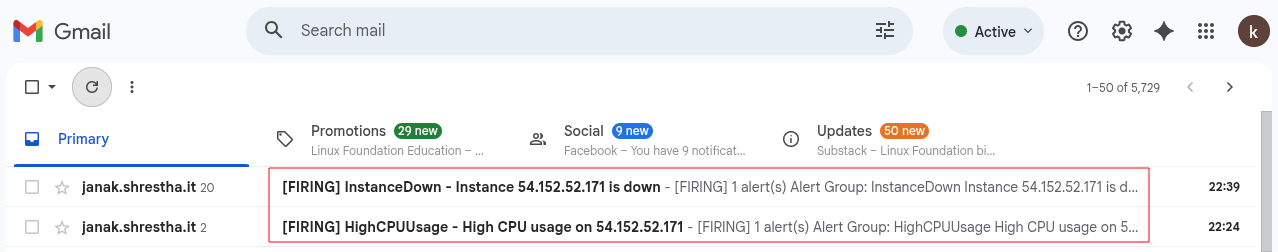
Firing Alert Emails
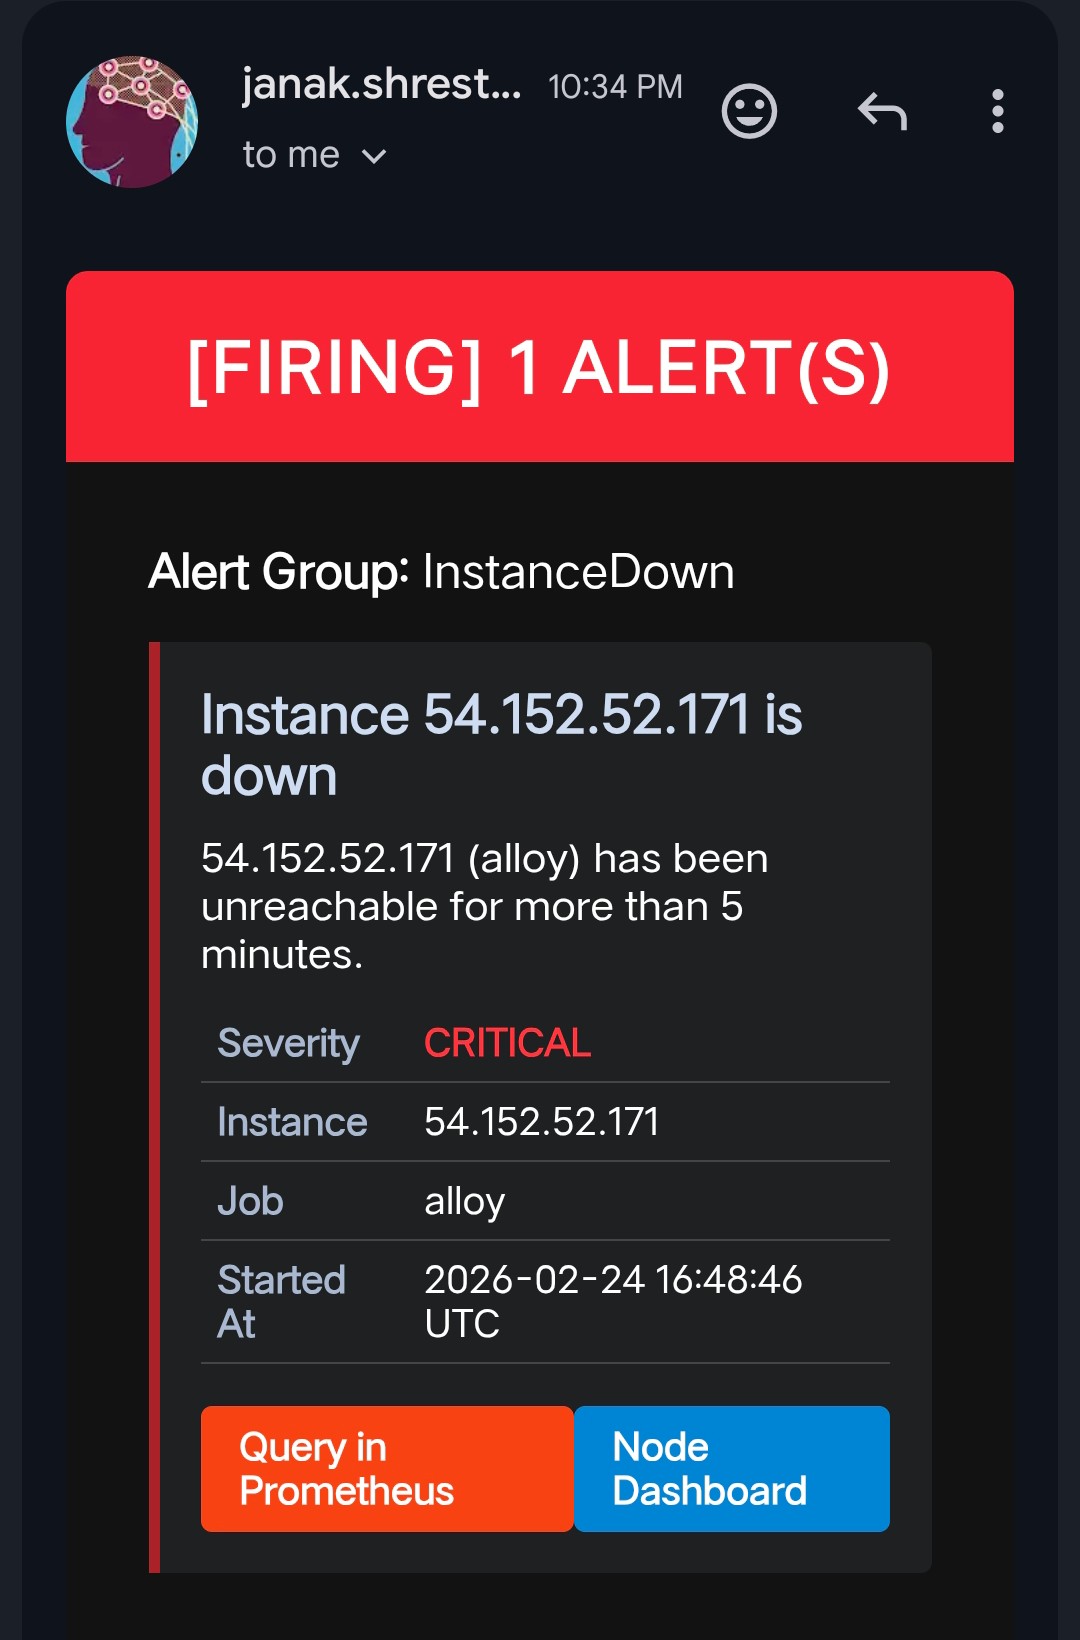 —
— 
Resolved Alert Emails
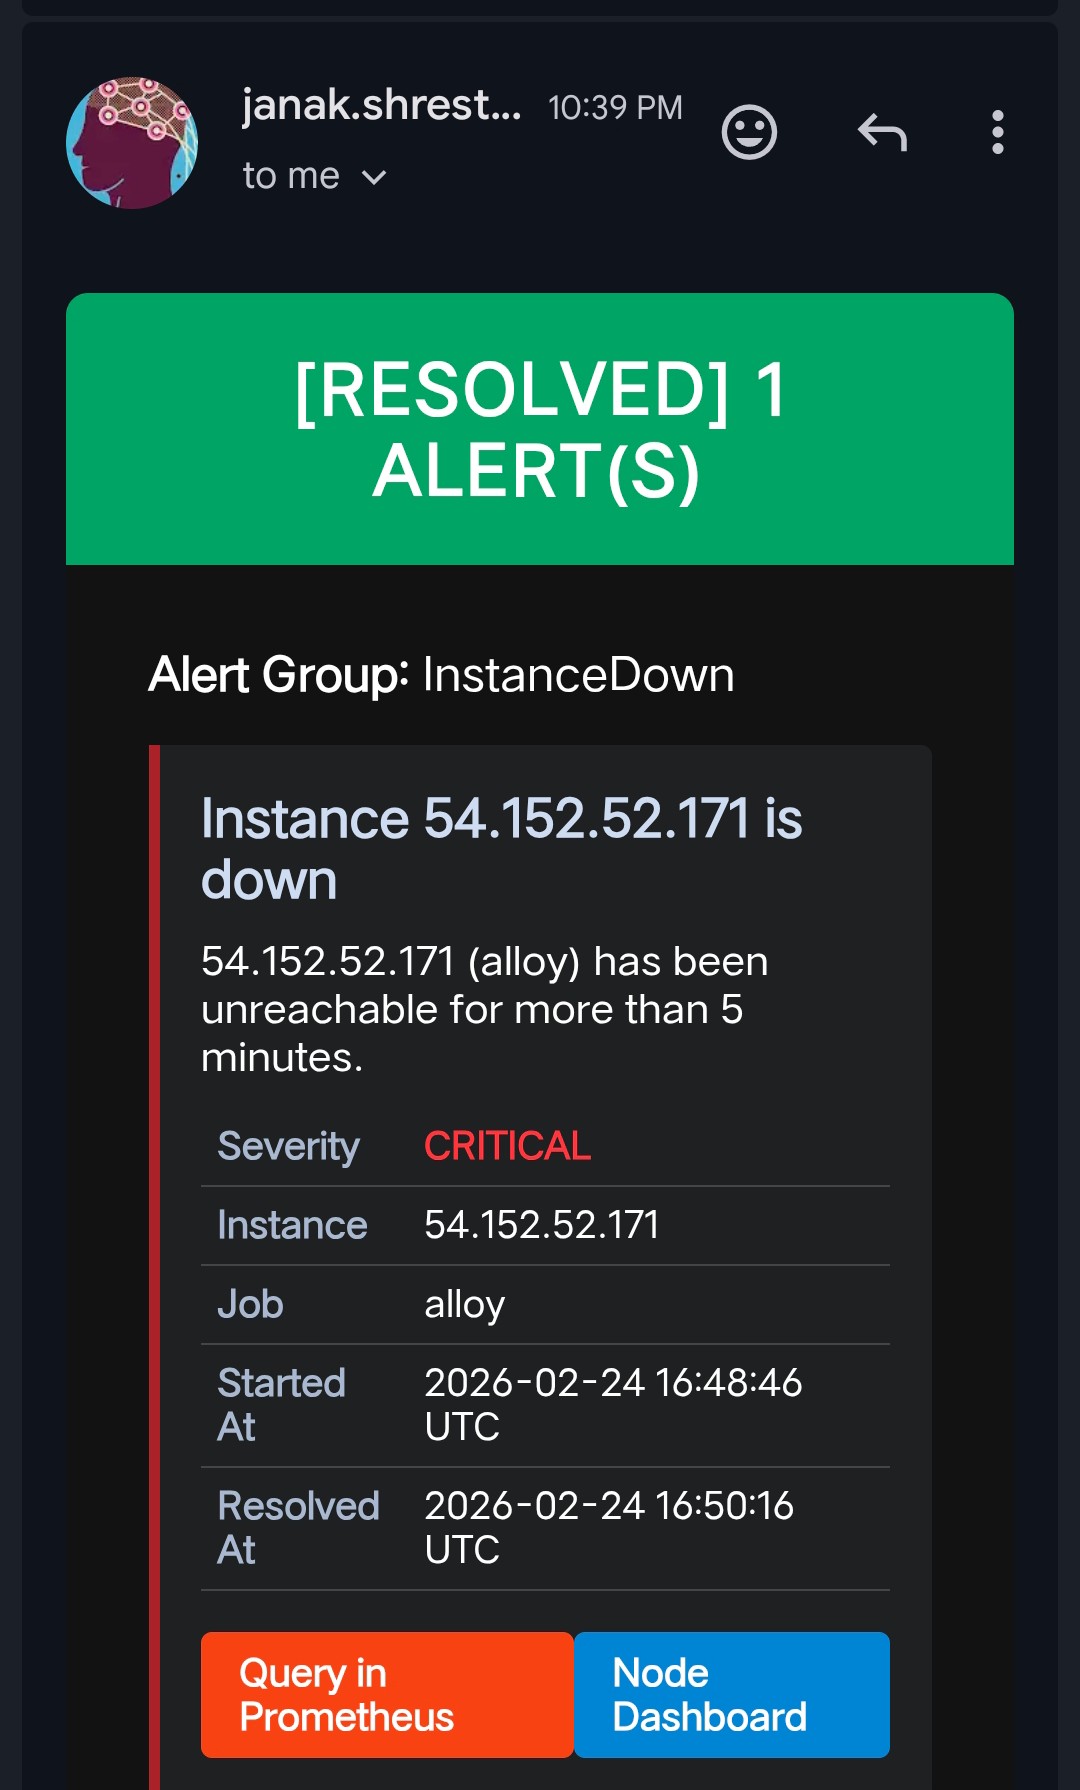 —
— 
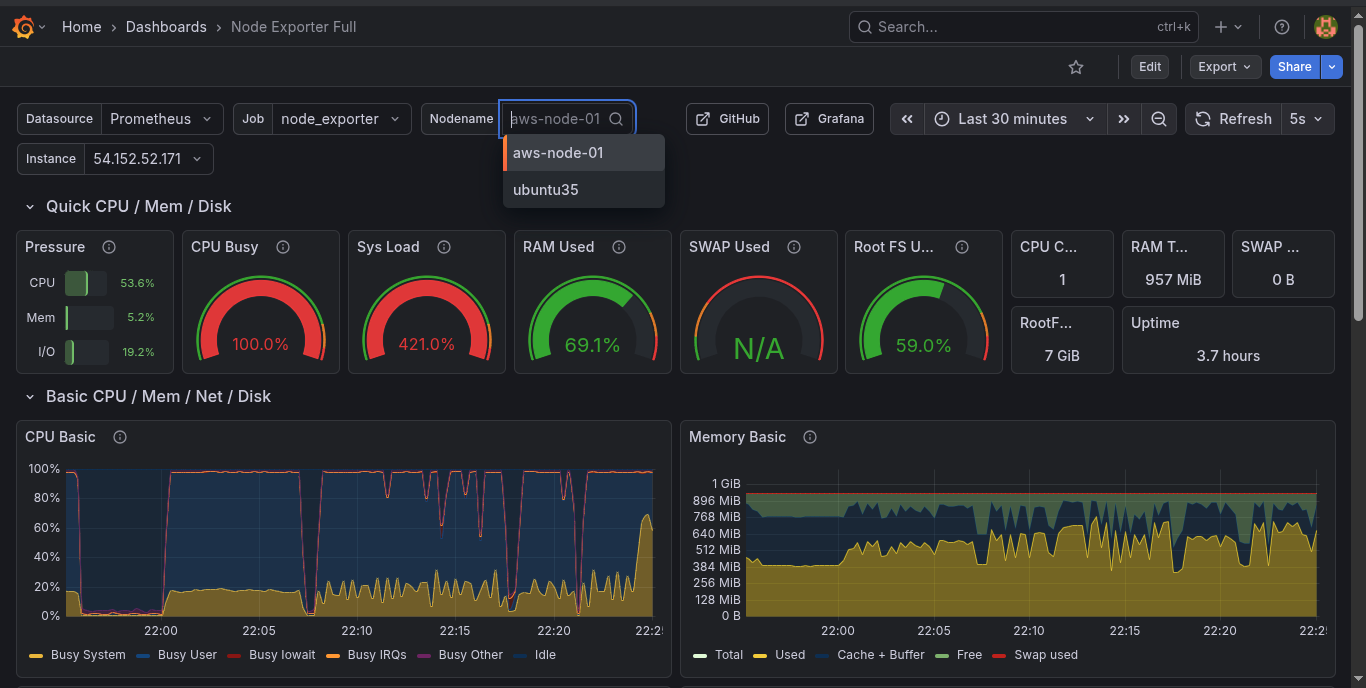
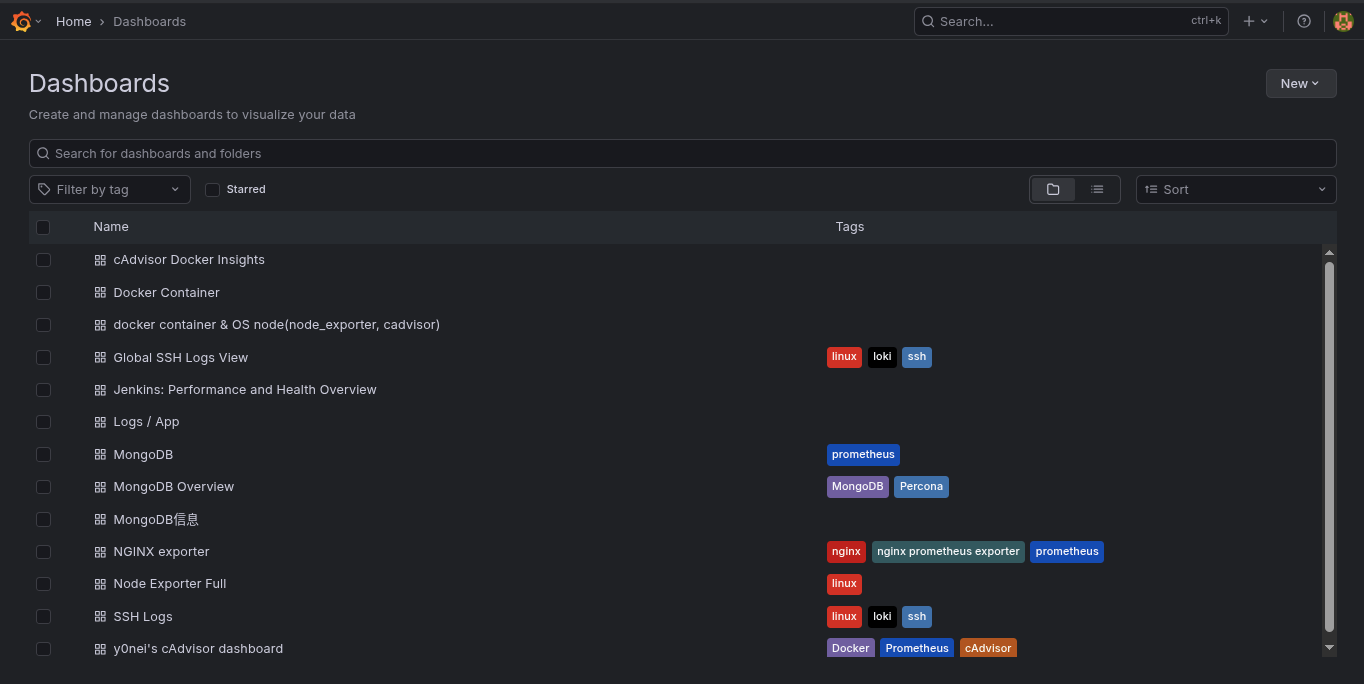
Dashboards
On day one of the project being live, I had immediate visibility across the entire infrastructure through pre-imported Grafana dashboards. These are automatically provisioned via Grafana’s dashboard provisioning API — no manual import required.
| Dashboard | Grafana ID |
|---|---|
| Full Node Exporter (OS Metrics) | 1860 |
| Docker Container & Node Overview | 16314 |
| cAdvisor Docker Insights | 19908 |
| Jenkins Health & Performance | 9964 |
| Nginx Request Rates | 12708 |
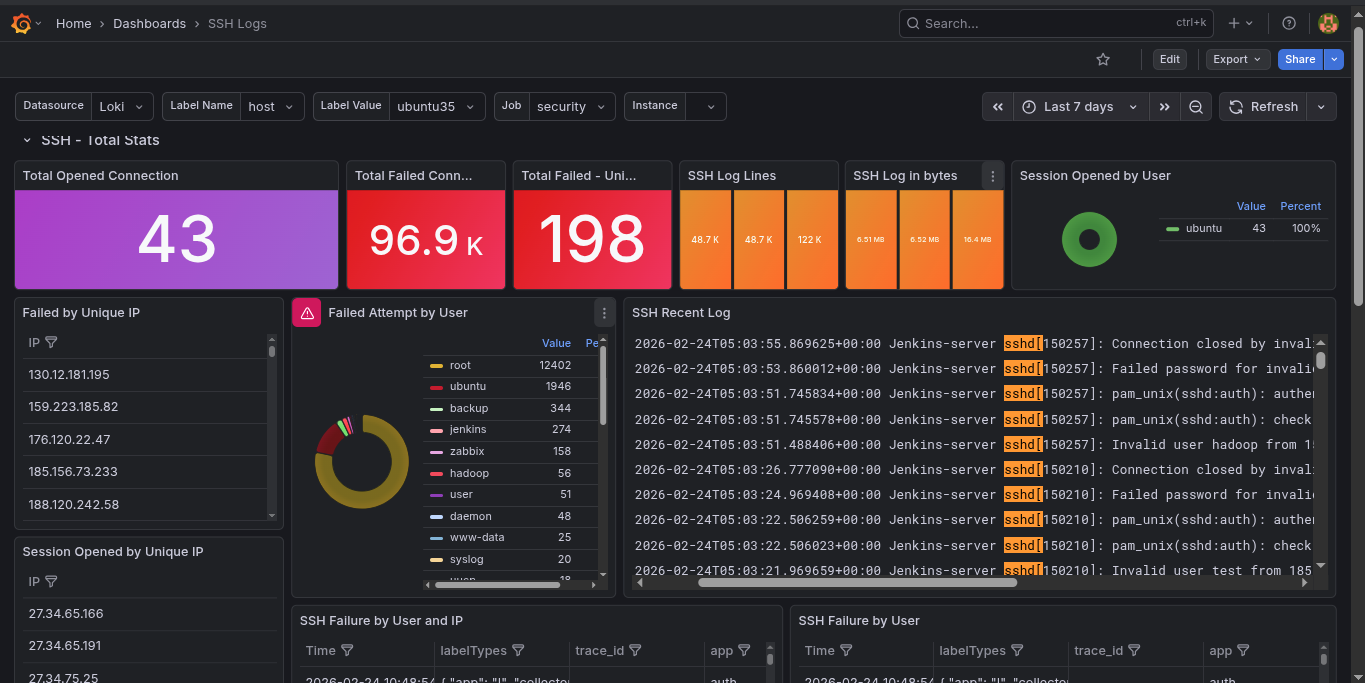
| SSH Login Audit Logs | 17514 |
| Application Log Explorer | 13639 |
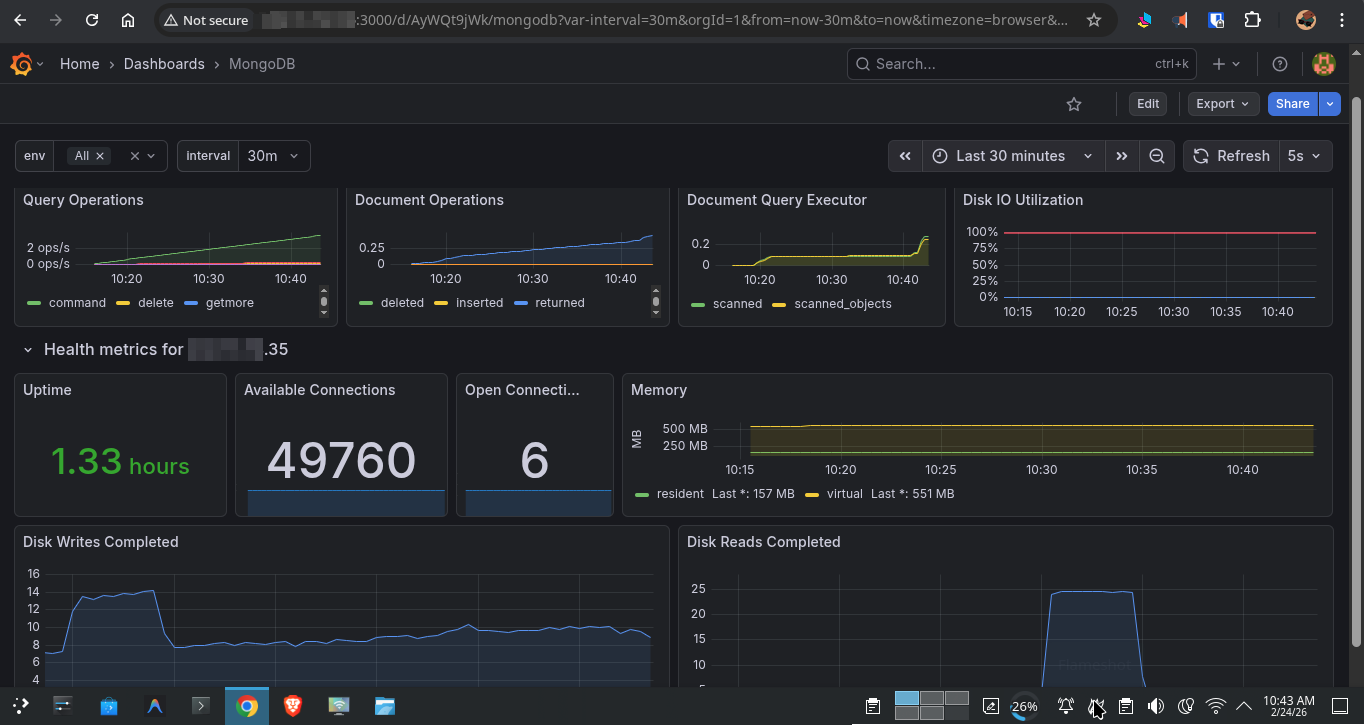
| MongoDB Overview | 2583 |
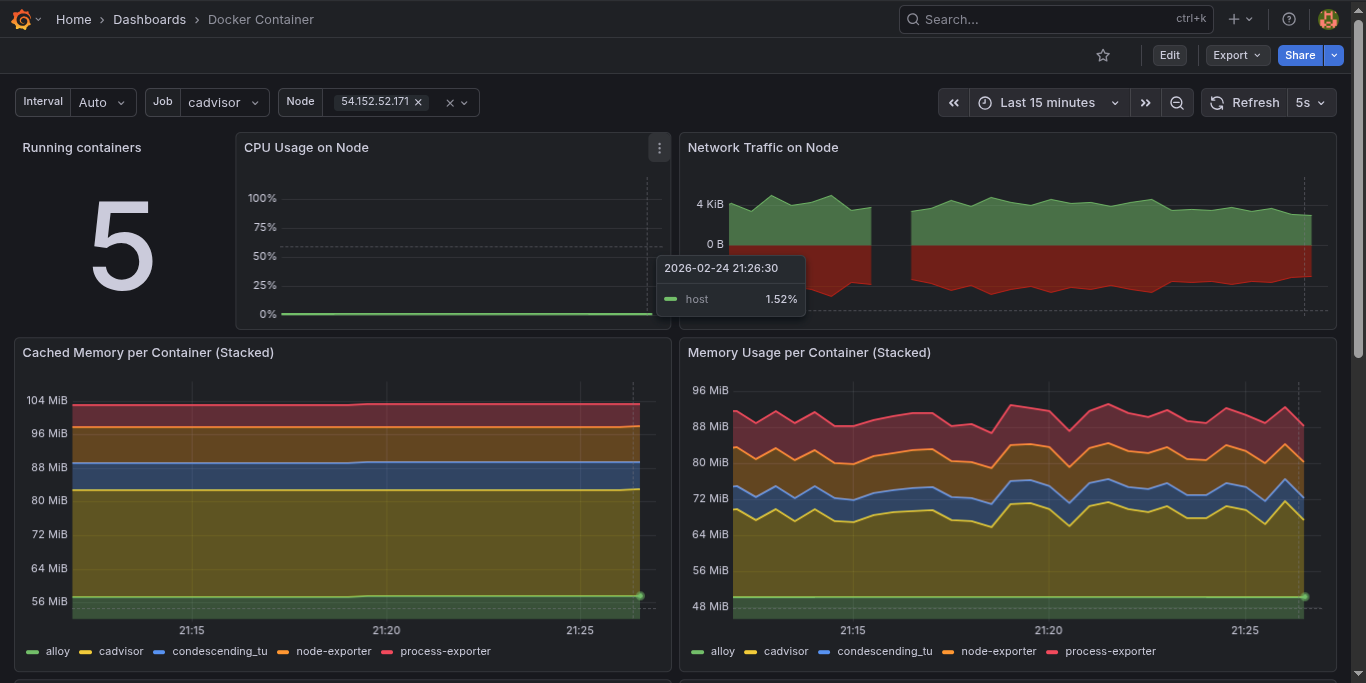
Docker Container Overview
Server Grafana Dashboard
SSH Auth Logs Dashboard
What I Learned
1. Complexity hides in credentials. AWS Academy’s short-lived session tokens (AWS_SESSION_TOKEN) were my biggest headache — they expire every 4 hours, which breaks Loki’s S3 connection silently. Building a pattern for rotating them quickly became critical.
2. Prometheus does not expand environment variables inside ec2_sd_configs. Unlike the rest of prometheus.yml, the region field inside EC2 SD must be hardcoded — ${VAR} syntax is silently ignored. Spent more time on this than I care to admit.
3. host.docker.internal is your best friend. Without it, no Docker container can reach services running on the host OS. This was the root cause of nginx_up 0 that had me confused for longer than it should have.
4. Labeling is everything in Loki. A well-labeled log is worth 100 unlabeled ones. Setting NODE_HOSTNAME, environment, and container_name labels correctly on every log stream is what makes Grafana’s log queries fast and readable.
5. .env-driven configuration pays off immediately. Every value that could change between environments — hostnames, ports, credentials, storage backends — lives in a single .env file. This meant deploying to a new node was copy-paste, not a 30-minute config surgery.
6. Docker Compose profiles are perfect for optional exporters. Not every node runs Jenkins or MongoDB. Using Compose profiles (--profile nginx, --profile jenkins) keeps the compose file unified while letting each node only run what it needs.
Wrapping Up
This isn’t a toy project — it’s a fully battle-hardened, modular monitoring system that I now run on production infrastructure. The .env-driven configuration model means it deploys cleanly to any new server in minutes, and the Docker Compose profiles make it easy to enable only the exporters each node actually needs.
Whether you’re monitoring a single VPS or a fleet of EC2 instances, this stack gives you full visibility into system health, container performance, application metrics, and centralized logs — with real-time email alerts the moment something goes wrong.
If you want to explore the full source code, configuration files, and step-by-step deployment guides, the complete project is available on GitHub:
GitHub Repo: github.com/janak0ff/observability